3.2. Statistical Shape Models
(Pioneered in the medical domain by Prof. Tim Cootes ).
Model-based methods, such as Snakes and Level Sets, typically have no way to encode physically plausible shapes into them.
So, we will study Statistical Shape Models (SSM):
they are based on real examples, and model likely variation in physical anatomy
can be used for segmentation
can be used for registration
so are a useful, predictable, starting point for CAS/CAI applications
The reason to include them in a CAS course, is that they result in very few parameters to optimise during run-time, during surgery. While deep learning models can be used for segmentation very well, its not always obvious how well they can be used for registration, and how well parameterised the model is, and how well the deeply-learnt model can reflect anatomical variation. Use of deep learning for real-time registration is very much an ongoing research area.
3.2.1. Model Formulation

Fig. 3.3 A scatter plot of samples that are distributed according a multivariate (bivariate) Gaussian distribution. By Nicoguaro on Wikimedia, licenced under CC BY-SA 4.0.
Looking at the above examples:
The “raw data”, is (x, y) pairs from two random variables.
But as a human we can see additional information.
There is a long diagonal, where most of the variation is.
There is also some width, as points spread out perpendicular to this diagonal.
There is also a mean (average) position, at the centroid of the data.
So, Principal Component Analysis (PCA) gives us a way of expressing a dataset in terms of the main directions of variation.
The procedure starts with:
Take a set of shapes, given by corresponding points
Align centroids, normalise scale
Then: (with notation from Peters and Cleary, “Image-Guided Interventions: Technology and Applications”)
Let a shape be represented by  -dimensional vector
  where
where  is the number of landmarks.
The mean shape is:
where  is the number of shapes in the training set.
The covariance matrix of these shapes is:
which encodes the amount of variation of one variable (e.g., x,y,z location) with another.
It can be shown, (see [Shlens2014]) that the matrix of eigen vectors  of the covariance matrix
are the principal components of the shape. The eigenvalues indicate the scaling, or importance of
the corresponding eigen vector.
of the covariance matrix
are the principal components of the shape. The eigenvalues indicate the scaling, or importance of
the corresponding eigen vector.
So, eigen vectors and the corresponding eigen values are then sorted by the magnitude of the eigen vector.
If you sum the eigenvalues:

which gives a measure of the total variation or scaling, then we can compute
how many eigen-values do we need to capture say  of the variance.
So choose  such that

and
Any shape in the training set can now be approximated by:

where b is a weighting to apply to each eigenvector.
3.2.2. Workshop 3
We shall see PCA in action, and visualise shape models of the prostate.
Fig. 3.4 A shape model of the prostate, courtesy of Dr Yipeng Hu.
The code to generate an SSM is here:
git clone https://github.com/YipengHu/MPHY0030.git
cd MPHY0030/tutorials/statistical_motion_model
3.2.3. Active Shape Models
Of particular interest to CAS/IGI, SSM can be used for segmentation and registration, by model fitting.
Provide an initial alignment to an image
For each point in the model, search outwards, looking for intensity gradient for example
For each point, identify a target point
Adjust shape to fit points (optimise the weightings vector :mat:`\bar{b}`)
Repeat
Its like non-rigid, biologically plausible ICP.
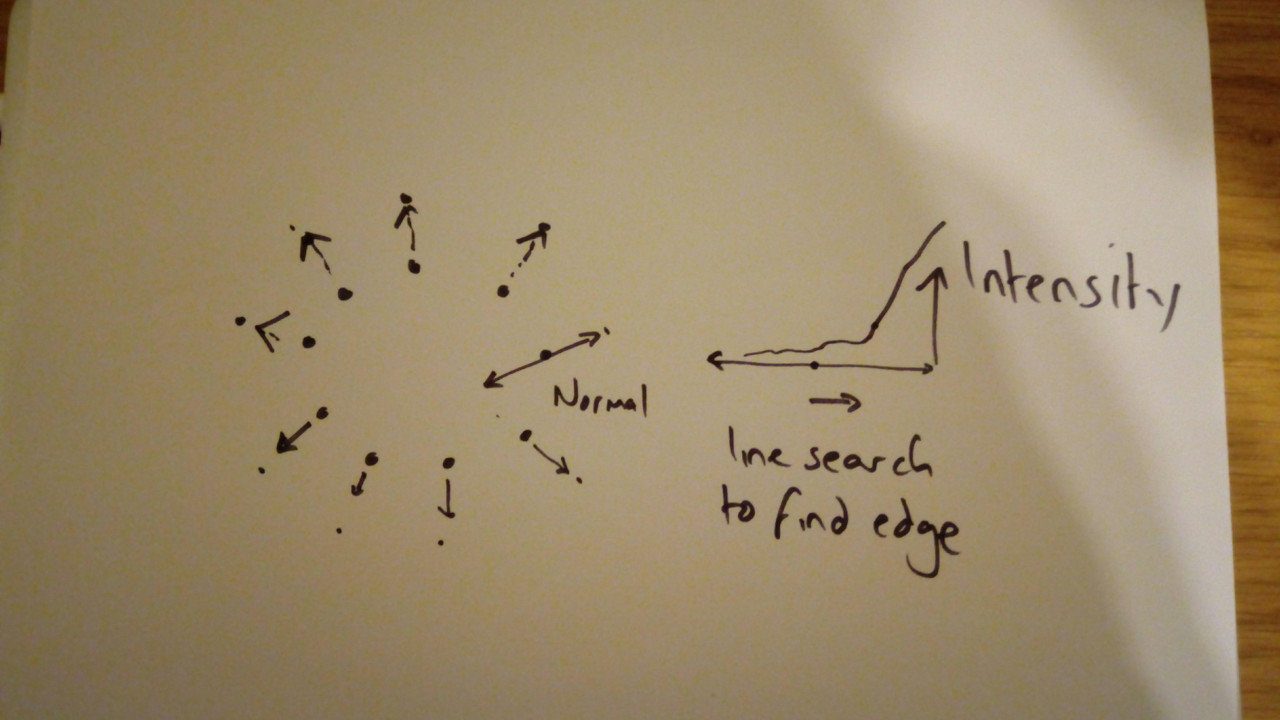
Fig. 3.5 A quick sketch illustrating AAM. For each point, find better point, then fit model.
The above process is itself a registration.
Also, once converged, label everything inside the model as segmented.
Can also be used: Register patient model to mean model, register mean model to image data
Fig. 3.6 Animation depicting a shape model derived from MRI simulations to intra-operative Ultrasound, courtesy of Dr Yipeng Hu.