1.4. System Components
1.4.1. Learning Objectives
Upon completion of this section, the student will be able to:
Recall the main components
Understand that the system performance is the sum of each part
1.4.2. Introduction
As mentioned in papers like [PetersCleary2010], a CAS system normally comprises:
Imaging
Segmentation
Tracking / Calibration
Registration
Visualisation
User interface
1.4.3. Imaging
This isn’t a course in imaging. Common types include:
Pre-op: MR, CT, PET, SPECT, DTI, DSA
Intra-op: Video, Ultrasound, X-Ray (flouroscopy), PA
1.4.4. Segmentation
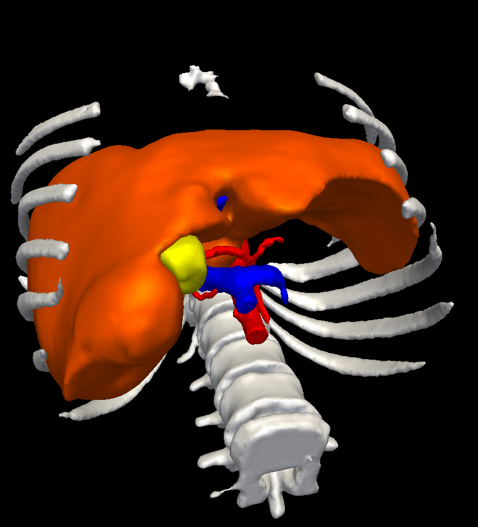
Fig. 1.8 Data from CT scans can be converted to triangle meshes and rendered. This example produced by Visible Patient.
In this course we will cover:
Segmentation methods, e.g. manual, automatic.
Conversion to a mesh, smoothing, decimation.
1.4.5. Tracking / Calibration
Fig. 1.9 Atracsys (top) and NDI Polaris Veiga (bottom) optical trackers.
Fig. 1.10 NDI Aurora Tracker: Left-to-right: System Control Unit, Sensor Interface Unit, Pointer, Field Generator.
In this course we will cover:
Optical tracking
Electro-magnetic (EM) tracking
1.4.6. Registration
Registration is the process of aligning coordinate systems. In Medical Image Computing, registration is normally between two 3D images, for example, registering an MR scan to a CT scan of the same patient. However, in CAS systems, the challenge is often registering to the physical space of the patient, which is constantly changing (e.g breathing), or deforming (soft tissues).
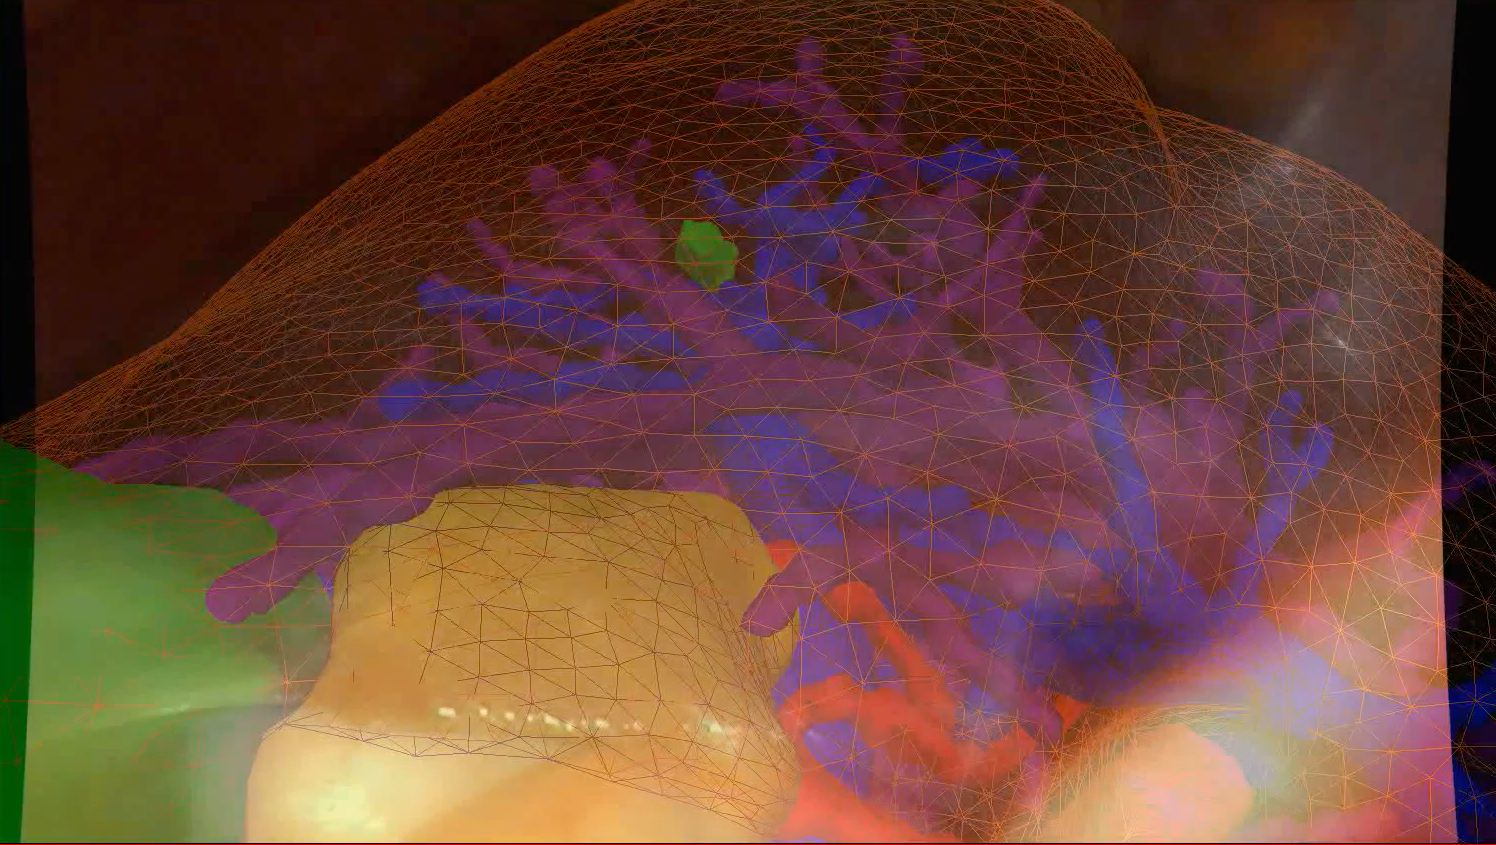
Fig. 1.11 Registration is aligning various images. Here a pre-operative model is aligned to intra-operative laparoscopic video, see [Thompson2015].
1.4.7. Visualisation
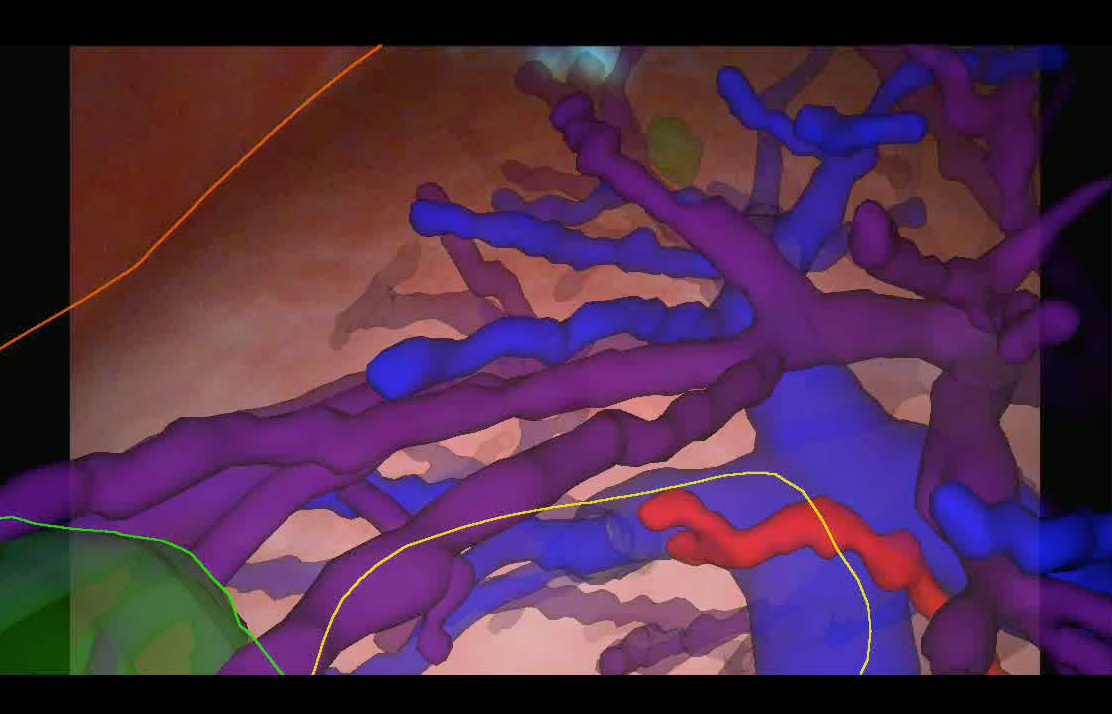
Fig. 1.12 Examples of Visualisations from the SmartLiver project. (top) Wireframe and too many meshes is confusing. (bottom) We experimented with depth fogging and outlines.
1.4.8. User Interface
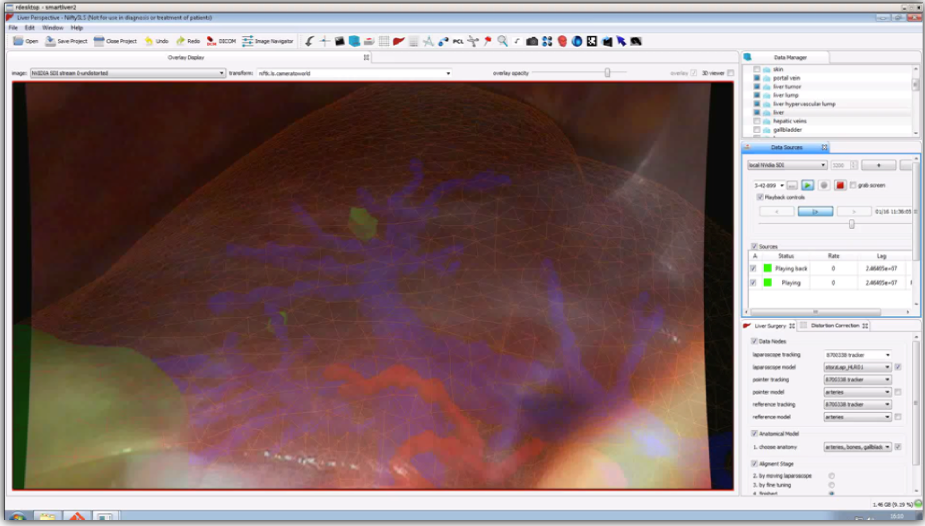
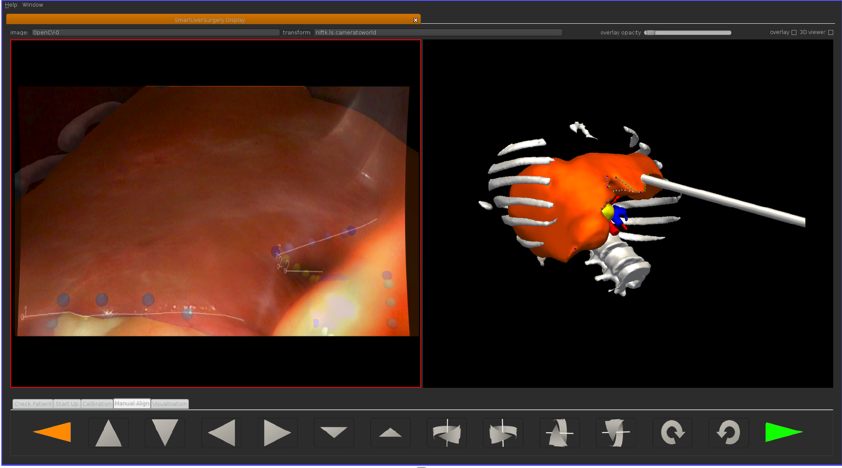
Fig. 1.13 Examples of User Interfaces from the SmartLiver project. (top) Desktop application was not very suitable for the OR. (bottom) Complexity was reduced over time to improve usability, and to work on a touchscreen [Thompson2018].
Developing effective visualisations is an on-going area of research. It’s not just a case of pretty graphics. The challenge is to present the most useful information, at the correct point in a procedure, without distracting the surgeon and causing attention blindness.
1.4.9. A System-Wide Approach
So, the field of CAS is very diverse and multi-disciplinary. To deploy a CAS system to the OR requires an understanding of all the components.
While an individual project, or research may choose to focus on one small component, there must always be an eye on the bigger picture, to make sure the system is workable in practice.